llvm-exegesis - LLVM Machine Instruction Benchmark
SYNOPSIS
llvm-exegesis [options]
DESCRIPTION
llvm-exegesis is a benchmarking tool that uses information available in LLVM to measure host machine instruction characteristics like latency, throughput, or port decomposition.
Given an LLVM opcode name and a benchmarking mode, llvm-exegesis generates a code snippet that makes execution as serial (resp. as parallel) as possible so that we can measure the latency (resp. inverse throughput/uop decomposition) of the instruction. The code snippet is jitted and executed on the host subtarget. The time taken (resp. resource usage) is measured using hardware performance counters. The result is printed out as YAML to the standard output.
The main goal of this tool is to automatically (in)validate the LLVM’s TableDef scheduling models. To that end, we also provide analysis of the results.
llvm-exegesis can also benchmark arbitrary user-provided code snippets.
EXAMPLE 1: benchmarking instructions
Assume you have an X86-64 machine. To measure the latency of a single instruction, run:
$ llvm-exegesis -mode=latency -opcode-name=ADD64rr
Measuring the uop decomposition or inverse throughput of an instruction works similarly:
$ llvm-exegesis -mode=uops -opcode-name=ADD64rr
$ llvm-exegesis -mode=inverse_throughput -opcode-name=ADD64rr
The output is a YAML document (the default is to write to stdout, but you can redirect the output to a file using -benchmarks-file):
---
key:
  opcode_name:     ADD64rr
  mode:            latency
  config:          ''
cpu_name:        haswell
llvm_triple:     x86_64-unknown-linux-gnu
num_repetitions: 10000
measurements:
  - { key: latency, value: 1.0058, debug_string: '' }
error:           ''
info:            'explicit self cycles, selecting one aliasing configuration.
Snippet:
ADD64rr R8, R8, R10
'
...
To measure the latency of all instructions for the host architecture, run:
#!/bin/bash
readonly INSTRUCTIONS=$(($(grep INSTRUCTION_LIST_END build/lib/Target/X86/X86GenInstrInfo.inc | cut -f2 -d=) - 1))
for INSTRUCTION in $(seq 1 ${INSTRUCTIONS});
do
  ./build/bin/llvm-exegesis -mode=latency -opcode-index=${INSTRUCTION} | sed -n '/---/,$p'
done
FIXME: Provide an llvm-exegesis option to test all instructions.
EXAMPLE 2: benchmarking a custom code snippet
To measure the latency/uops of a custom piece of code, you can specify the snippets-file option (- reads from standard input).
$ echo "vzeroupper" | llvm-exegesis -mode=uops -snippets-file=-
Real-life code snippets typically depend on registers or memory. llvm-exegesis checks the liveliness of registers (i.e. any register use has a corresponding def or is a “live in”). If your code depends on the value of some registers, you have two options:
Mark the register as requiring a definition. llvm-exegesis will automatically assign a value to the register. This can be done using the directive LLVM-EXEGESIS-DEFREG <reg name> <hex_value>, where <hex_value> is a bit pattern used to fill <reg_name>. If <hex_value> is smaller than the register width, it will be sign-extended.
Mark the register as a “live in”. llvm-exegesis will benchmark using whatever value was in this registers on entry. This can be done using the directive LLVM-EXEGESIS-LIVEIN <reg name>.
For example, the following code snippet depends on the values of XMM1 (which will be set by the tool) and the memory buffer passed in RDI (live in).
# LLVM-EXEGESIS-LIVEIN RDI
# LLVM-EXEGESIS-DEFREG XMM1 42
vmulps        (%rdi), %xmm1, %xmm2
vhaddps       %xmm2, %xmm2, %xmm3
addq $0x10, %rdi
EXAMPLE 3: analysis
Assuming you have a set of benchmarked instructions (either latency or uops) as YAML in file /tmp/benchmarks.yaml, you can analyze the results using the following command:
  $ llvm-exegesis -mode=analysis \
-benchmarks-file=/tmp/benchmarks.yaml \
-analysis-clusters-output-file=/tmp/clusters.csv \
-analysis-inconsistencies-output-file=/tmp/inconsistencies.html
This will group the instructions into clusters with the same performance characteristics. The clusters will be written out to /tmp/clusters.csv in the following format:
cluster_id,opcode_name,config,sched_class
...
2,ADD32ri8_DB,,WriteALU,1.00
2,ADD32ri_DB,,WriteALU,1.01
2,ADD32rr,,WriteALU,1.01
2,ADD32rr_DB,,WriteALU,1.00
2,ADD32rr_REV,,WriteALU,1.00
2,ADD64i32,,WriteALU,1.01
2,ADD64ri32,,WriteALU,1.01
2,MOVSX64rr32,,BSWAP32r_BSWAP64r_MOVSX64rr32,1.00
2,VPADDQYrr,,VPADDBYrr_VPADDDYrr_VPADDQYrr_VPADDWYrr_VPSUBBYrr_VPSUBDYrr_VPSUBQYrr_VPSUBWYrr,1.02
2,VPSUBQYrr,,VPADDBYrr_VPADDDYrr_VPADDQYrr_VPADDWYrr_VPSUBBYrr_VPSUBDYrr_VPSUBQYrr_VPSUBWYrr,1.01
2,ADD64ri8,,WriteALU,1.00
2,SETBr,,WriteSETCC,1.01
...
llvm-exegesis will also analyze the clusters to point out inconsistencies in the scheduling information. The output is an html file. For example, /tmp/inconsistencies.html will contain messages like the following :
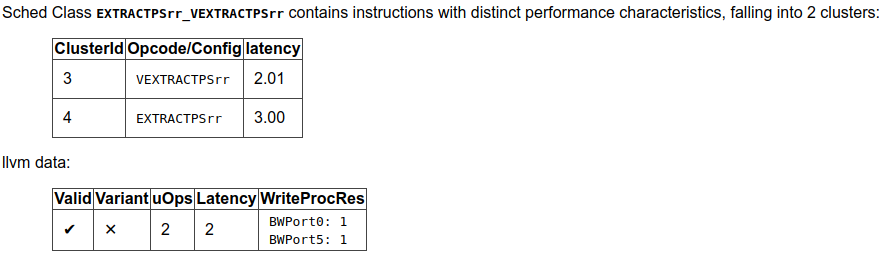
Note that the scheduling class names will be resolved only when llvm-exegesis is compiled in debug mode, else only the class id will be shown. This does not invalidate any of the analysis results though.
OPTIONS
-
-help¶ Print a summary of command line options.
-
-opcode-index=<LLVM opcode index>¶ Specify the opcode to measure, by index. Specifying -1 will result in measuring every existing opcode. See example 1 for details. Either opcode-index, opcode-name or snippets-file must be set.
-
-opcode-name=<opcode name 1>,<opcode name 2>,...¶ Specify the opcode to measure, by name. Several opcodes can be specified as a comma-separated list. See example 1 for details. Either opcode-index, opcode-name or snippets-file must be set.
-
-snippets-file=<filename>¶ Specify the custom code snippet to measure. See example 2 for details. Either opcode-index, opcode-name or snippets-file must be set.
-
-mode=[latency|uops|inverse_throughput|analysis]¶ Specify the run mode. Note that if you pick analysis mode, you also need to specify at least one of the -analysis-clusters-output-file= and -analysis-inconsistencies-output-file=.
-
-repetition-mode=[duplicate|loop|min]¶ Specify the repetition mode. duplicate will create a large, straight line basic block with num-repetitions copies of the snippet. loop will wrap the snippet in a loop which will be run num-repetitions times. The loop mode tends to better hide the effects of the CPU frontend on architectures that cache decoded instructions, but consumes a register for counting iterations. If performing an analysis over many opcodes, it may be best to instead use the min mode, which will run each other mode, and produce the minimal measured result.
-
-num-repetitions=<Number of repetitions>¶ Specify the number of repetitions of the asm snippet. Higher values lead to more accurate measurements but lengthen the benchmark.
-
-max-configs-per-opcode=<value>¶ Specify the maximum configurations that can be generated for each opcode. By default this is 1, meaning that we assume that a single measurement is enough to characterize an opcode. This might not be true of all instructions: for example, the performance characteristics of the LEA instruction on X86 depends on the value of assigned registers and immediates. Setting a value of -max-configs-per-opcode larger than 1 allows llvm-exegesis to explore more configurations to discover if some register or immediate assignments lead to different performance characteristics.
-
-benchmarks-file=</path/to/file>¶ File to read (analysis mode) or write (latency/uops/inverse_throughput modes) benchmark results. “-” uses stdin/stdout.
-
-analysis-clusters-output-file=</path/to/file>¶ If provided, write the analysis clusters as CSV to this file. “-” prints to stdout. By default, this analysis is not run.
-
-analysis-inconsistencies-output-file=</path/to/file>¶ If non-empty, write inconsistencies found during analysis to this file. - prints to stdout. By default, this analysis is not run.
-
-analysis-clustering=[dbscan,naive]¶ Specify the clustering algorithm to use. By default DBSCAN will be used. Naive clustering algorithm is better for doing further work on the -analysis-inconsistencies-output-file= output, it will create one cluster per opcode, and check that the cluster is stable (all points are neighbours).
-
-analysis-numpoints=<dbscan numPoints parameter>¶ Specify the numPoints parameters to be used for DBSCAN clustering (analysis mode, DBSCAN only).
-
-analysis-clustering-epsilon=<dbscan epsilon parameter>¶ Specify the epsilon parameter used for clustering of benchmark points (analysis mode).
-
-analysis-inconsistency-epsilon=<epsilon>¶ Specify the epsilon parameter used for detection of when the cluster is different from the LLVM schedule profile values (analysis mode).
-
-analysis-display-unstable-clusters¶ If there is more than one benchmark for an opcode, said benchmarks may end up not being clustered into the same cluster if the measured performance characteristics are different. by default all such opcodes are filtered out. This flag will instead show only such unstable opcodes.
-
-ignore-invalid-sched-class=false¶ If set, ignore instructions that do not have a sched class (class idx = 0).
-
-mcpu=<cpu name>¶ If set, measure the cpu characteristics using the counters for this CPU. This is useful when creating new sched models (the host CPU is unknown to LLVM).
-
--dump-object-to-disk=true¶ By default, llvm-exegesis will dump the generated code to a temporary file to enable code inspection. You may disable it to speed up the execution and save disk space.
EXIT STATUS
llvm-exegesis returns 0 on success. Otherwise, an error message is printed to standard error, and the tool returns a non 0 value.